What Is a Supply Chain Attack?

This article was originally written in 2017.

We all know the story of the Trojan horse. What we don’t know is why the Trojans didn’t take the horse and lock it in a room for a week, flood it, and then haul it out in the town square once they were sure it was safe. If the Trojans had been less trusting, a smelly wooden eyesore would be the worst of their problems. Instead, they lost everything.

Even though everyone knows this story, we still make the same mistake today: we are too trusting.

It’s now 2017, and data breach is the norm. Over the last ten years, 9 billion records have been compromised, with nearly 2 billion in 2017 alone. Even as we adapt better security practices and spend more money to protect ourselves, attackers are finding new ways to exploit weaknesses in a company’s defenses.

One increasingly common attack is called a supply chain attack, where an attacker slips malware or a rootkit into a software update without the developers noticing. This is the type of attack which caused the massive Target breach of 2013 that gave attackers access to 41 million consumers’ personal information.

The idea that malware is lurking in your software updates is frightening — and it should be. If a supply chain attack succeeds, the hacker gains access to millions of computers all at once. All it takes is one developer making a mistake or not reviewing the code thoroughly, and a contaminated update is released to everyone using the software. These attacks create disruption all the way up to the Executive level — but what can be done to prevent them?

Fortunately, SpiderOak has an answer.

Our Secure Application Updater is based on the platform we created to build our own products. We use blockchain technology to secure every step of the release process, verifying the identify of each developer working on it and ensuring the code is never tampered with. Using cryptography, we can help you be absolutely sure that malicious code will never make it into your updates.

It’s time to change the way we think about protecting our companies. Stop trusting everyone and you can change how history will remember you: not as a tragedy, but as a breach-free company with some questionable taste in horse sculptures.

……

A dangerous threat that takes advantage of the inherent trust between users and their software providers is a growing trend.

“Security researchers from Check Point Software Technologies recently found around 50 malware-infected Android applications hosted on Google Play that had been downloaded millions of times. They determined that the malicious code was actually part of a third-party SDK that app developers had integrated into their apps.”

What can we expect in 2018?

In 2018, we expect to see advanced threat actors playing to their new strengths, honing their new tools and the terrifying angles described above.

How to Avoid Becoming Another GoPro

Just over a week into the new year, we saw GoPro flounder. There are multiple reasons for this, and probably countless articles talking about how the company could have avoided where it is today.

One such article had this interesting little sentence:

“Like Flip before them, they became a fad then a tool then a commodity finally leading to a battle that they were never born to win.”

“It’s a little dark to say that they were never born to win. We’d like to take a little more positive approach (new year, new us): you can go into battles and win. Amazon hasn’t taken over just yet.”

One note to add: In doing some trait analysis of the GoPro customer, some of the dominant traits indicate rare densities. Thus, limitations in total addressable market. Not everyone needs this and wants to do this. It is not a job to be done for everyone.

How can you win? Stop obsessing over slashing costs and being efficient. You can’t produce good marketing when you’re stressing over cost. Look at your customers again, past simple demographics. Think about who you are trying to attract, and who is actually your customer. You might be trying to go after suburban moms, but your customers are really urban males in their 20s (true story, different company).

Predictive analytics is young, but we believe its potential in segmenting customers based on quantifying customer delight and their personality traits. If you delight then, you don’t need to slash budgets.

https://techcrunch.com/2018/01/08/where-gopro-goes-next/

How banks use behavioral economics to win over customers

By Rob Garver

Published January 03 2018, 12:59pm EST

Originally published January 3rd, 2018, this article highlights some of the issues in placing “to put the technology cart before the psychology horse.” Its best to have a solid plan vs follow a tech trend.

To make your job much easier, more effective, predictive technologies can aid financial organizations with a way to balance customer equity with customer delight. By having a “win win” approach with your customer, sustainable profits and long term success can be achieved.

For the full article, please visit:

https://www.americanbanker.com/news/how-banks-use-behavioral-economics-to-win-over-customers

What is the psychometric difference between happiest and friendliest cities?

What makes a city happy? What makes a city friendly?

I built software designed to look at your CRM and figure out segments of customers and potential customers, why they buy and how to delight them. This technology is based on years of research, machine learning and big data, connecting human activities to lexical based, psychometric traits, the building blocks of personality. I see the world though a lexical interpretation of human activities. What you do in life can be a bridge to deep meaning and psychometric interpretation. With the help of many, here are our findings:

We found two independent list. While these are not my definitions of happy and friendly, I wanted to see how our software would judge the cities.

Think of a city as a CRM. Many segments exist within the city and it’s not fair to say everyone is happy and friendly in these cities. Our technology is just adding to what was already proposed, not defining it. In later documents, I may come up with my own list of happy and friendly cities as I think we have alternative lists.

Happiest Cities: https://www.nationalgeographic.com/travel/destinations/north-america/united-states/happiest-cities-united-states-2017/

The friendliest cities:

Dominate Human Activities of these cities are different:

Friendly cities compared to happy cities, all 10 together, are more focused on the arts, home, clothes and donating to social causes. Compared to happiest cities, they are much less interested in political contributions, investing, travel, and outdoor activities. There are few overlapping activities. Only investing and certain ‘signs of privilege’ metrics overlap for segments of the populations.

Boulder, Co — the happiest city in the US per National Geographic.

Human Traits:

Both cities are dominated by psychometric traits of intelligence, systematic thinking, optimism, positivity and self focus.

Summary:

Great differences exist within these cities and comparing one to the other. In reviewing the data, it is my opinion that a friendly city is a lot like a happy city. Great experiences, you can address strangers easily and see smiles on many faces as you walk around. So, if you made one list, psychometrically, you made the other, in my opinion.

These type of list get a lot of criticism and they should. They average far too many people into broad geographic areas. Maybe that is the point of this post: be careful averaging things that don’t fit well. Overall, consume carefully and find the interesting findings within.

New Orleans — on the the friendliest cities in the US.

Some details:

Analytical thinking — a high number reflects formal, logical, and hierarchical thinking. People who use analytical thinking appear to be very intelligent, or systematic. They pay close attention to details. They need facts, like organization and structure. They do not need as much outside stimulation.

They also have very high emotional tone. A high number is associated with a more positive, upbeat style. People tend to be optimistic, cheerful. They show more resilience in everyday situations.

How this applies to your organization:

Imagine applying this type of data to a CRM? It can help you predict and help describe what your organizations means to the world ,why it sells, and maybe why it can’t sell certain things.

We are designed to help you see your CRM in whole new way, psychometric way. We help you figure out why people buy long before they know what they want (predictive analytics). We look deep into what delights people (customer delight as a KPI) about your company. Having a deep understanding of people is a lot like knowing a friend. It significantly impacts conversion rates and retention.

Our technology is based on years of research, machine learning and big data, connecting human activities to lexical based, psychometric traits, the building blocks of personality. We see the world though a lexical based interpretation of human activities. What you do in life can be a bridge to deep meaning and psychometric interpretation about who we are and why we want and desire certain things.

Your Best Innovation Bet is in your Your Customer List

Based on the HRB article by Melissa Schilling, What’s Your Best Innovation Bet? July-Aug 2018

This is a very good article from my ‘go to’ source for innovation.

Its true that you never really know how a market will respond. Sadly, we leave too much to chance when creating products, sales and marketing plans and all the efforts associated with building something the public will desire.

Part of this article involves establishing 3 steps. Step One: Identify Key Dimensions

“Identifying the key dimensions of a technology’s progression is the first step in predicting its future” is a very smart place to start but I would add the following; Identifying customer segments based on desire, customer delight and placing revenue and profit for each, over time, will indicate where problems exist with the current and future product roadmap.

Tracing the technology should be tracing the “people evolution” in addition to the technology evolution. By focusing on people, in addition to product, we can see why people have certain desires and why not.

“To illustrate, let’s return to music-recording technology. Tracing its history reveals six dimensions that have been central to its development: desynchronization, cost, fidelity, music selection, portability, and customizability.” By appending psychometrics (personality traits) to customer segments, we can see how certain psychometrics attach to fidelity vs cost, music selection vs customization and so forth.

While current technology can survey well, problems exist with this method for predicting beyond a short runway. “Would consumers want an audio device that could sense and respond to their affect? If so, perhaps “anticipation of needs” is another key dimension.” It is.

Once we cluster what people want, we can improve prediction in a profound way. Simply put: focus on the customer and their desires, don’t average them but segment in a new way to predict what they want. Once connected to CRM, you have a powerful way to grow an organization and satisfy customers.

Dog Loving Cities in Louisiana

Living in Louisiana, one would think dog lovers are in the big cities. But maybe my bias comes from the fact that New Orleans has an all-dog Mardi Gras parade called the Krewe of Barkus. And possibly it’s because I follow so many dog Instagram accounts based in the Crescent City. Also, I just love dogs.

In our “lab” (pun completely intended), MakeBuzz calculated the index of dog density for the US as 0.152. New Orleans comes in around ? of that and Baton Rouge is 0.125.

Places like Omro, WI and Lamar, MO have high densities of dog ownership, approaching 50% more than cities in Louisiana.

New Orleans scores 0.075 and Baton Rouge, 0.125

What does it mean to have high dog density?

There are strong, practical reasons to own a dog that haven’t changed much in the thousands of years humans and dogs have lived together. Sometimes they are trained for hunting in rural areas. Likewise, people in cities often have dogs as part of their family, for protection, or for support reasons.

Understanding the demographics social reasons to own a dog is one frame of reference. Our technology allows us to look at the psychometrics of owning a dog.

Dog owners have high psychometric indexing for social activities with friends, family and neighbors. They tend to overuse auxiliary verbs, be present focused, use negation and have a high degree of clout within their community. You will find people in these towns positive but assertive and confident. Matches up to what dog owners should be like right?

There are many more characteristics to owning a dog. This is just a brief report on dog density ownership. We were surprised to find the bigger cities having less dogs.

When selling into a dog density city, having high confidence in your product, while using present tense, and negation could make a difference in optimal conversion rates.

This is just a small sample of what we can do. MakeBuzz looks at more than just dog ownership to help you understand your customers. Imagine having a full profile of your best customers, and then getting a lookalike audience. With all of our data and our key to what everything means, you’re sure to win.

What else do sympathetic people buy?

Sympathetic people, who care for the well-being of others, correlate to term life insurance buyers. If you market to people who send flowers, you should consider partnering with a term life insurance company. You should also consider why they decide and find creative ways to gain more share of wallet for many other things.

We do psychometric based research on the entire US population. Not surveys, cookie or click-based data. We convert human activities into a lexical based, psychometric view of people and why they decide. Our fears, thinking patterns, social patterns and personalities can be discovered and it starts within our customer files. Combined with technology and big data, we found ways to discover patterns that have never been seen before.

You can see for yourself that some of the below output is obvious and some interesting. It seems obvious that that term life buyers, who are also sympathetic are concerned about work but would you expect their emotional tone to be positive?

People who buy term life and sympathetic people share a common focus on achievement and goals. They make decisions fast. They are not long-term planners. They are optimistic, confident and socially oriented. They enjoy art, emotional stimulation and adventure. See below.

What does this mean for business:

  1. Psychometrics informs us of how we can describe our products to better address customers and future customers. better descriptions, based on who they are, not what they click, results in significant conversion rate changes.
  2. Focus on who matters most. We find too many descriptions of thing like term life, jumbled. We try to say too much. The message gets diluted and conversion suffers.
  3. This dramatically increases conversion becuase you ‘know’ the potential customer without any invasive means to discover what they want.

This is just a small start in what psychometrics can do for business, it has a dramatic impact on conversion and segmentation. Understanding the world beyond reactive data can drive significant marketshare and profit changes for the better. If interested, we are happy to find your connections.

Should Jobs to be Done Theory have a Technology Core?

If you are reading this, many of you are influenced by Clayton Christensen’s work in profound ways. For much of my career, I am speaking his words, combining my theories to his, into a myriad of situations. What he teaches works very well. What worries me is how scalable is it. Not just anyone can think the way he does and apply it to a business situation. There are strong forces at work to keep things the same. Just look at the long history of old and new companies that have floundered. They kept things the same.

In Clayton’s book Competing Against Luck, one of his core questions is ‘why is product development and innovation so hard?’ Can you do things to predict outcomes by deeply understanding people? Unfortunately, of the tens of thousands of products launched every year the vast majority struggle in the marketplace. The concept of understanding people is still very new.

When I read some of the early work of Jobs to be Done (JTBD) theory, I immediately wanted to turn this into software. Clayton teaches us that Disruptive Innovation must have a technology core that is affordable, accessible and easy to use. Bingo! Disruptive Innovation itself is complex and involves many different departments and tasks. Disruptive Innovation is a lot like building enterprise software. JTBD theory is another thing. For me, converting theories of people via psycholinguistics, is the pathway. It empowers Disruptive Innovation which means we must look for theories of people not based on ‘data of the past’ such as demographics, spend, clicks and cookies. Clicks are not people.

In my opinion it is JTBD software makes Disruptive Innovation scalable via a technology core. What I invented I wish to convert into an open source product that makes Clayton’s theories accessible, affordable and easy to use. There’s no reason why we should hold this great theory hostage.

Keeping the end in mind, Jobs to be Done software lets us empower organizations in ways we have never seen before. Predicting customers, balancing customer equity with customer delight, launch products that solve real needs and market them efficiently. To predict is to preserve and focus on what matters most to organizations and people.

Linguistic Analysis of Car Owners in Iowa. Does it matter?

Linguistic Analysis and car and truck ownership indicate traits are diverse by brand, model and location. Traits of people drive the reason to buy but where traits are located varies. For example, farming is a job to be done that influences the brand of vehicle we buy. I can’t use a Kia Soul to help me solve my farming jobs. The diversity of different brands offer customers different solutions to their ‘jobs to be done’.

We looked at common brands only, accessible to many without distribution barriers. Keep in mind, we looked at new and used cars and trucks over a 10 year period.

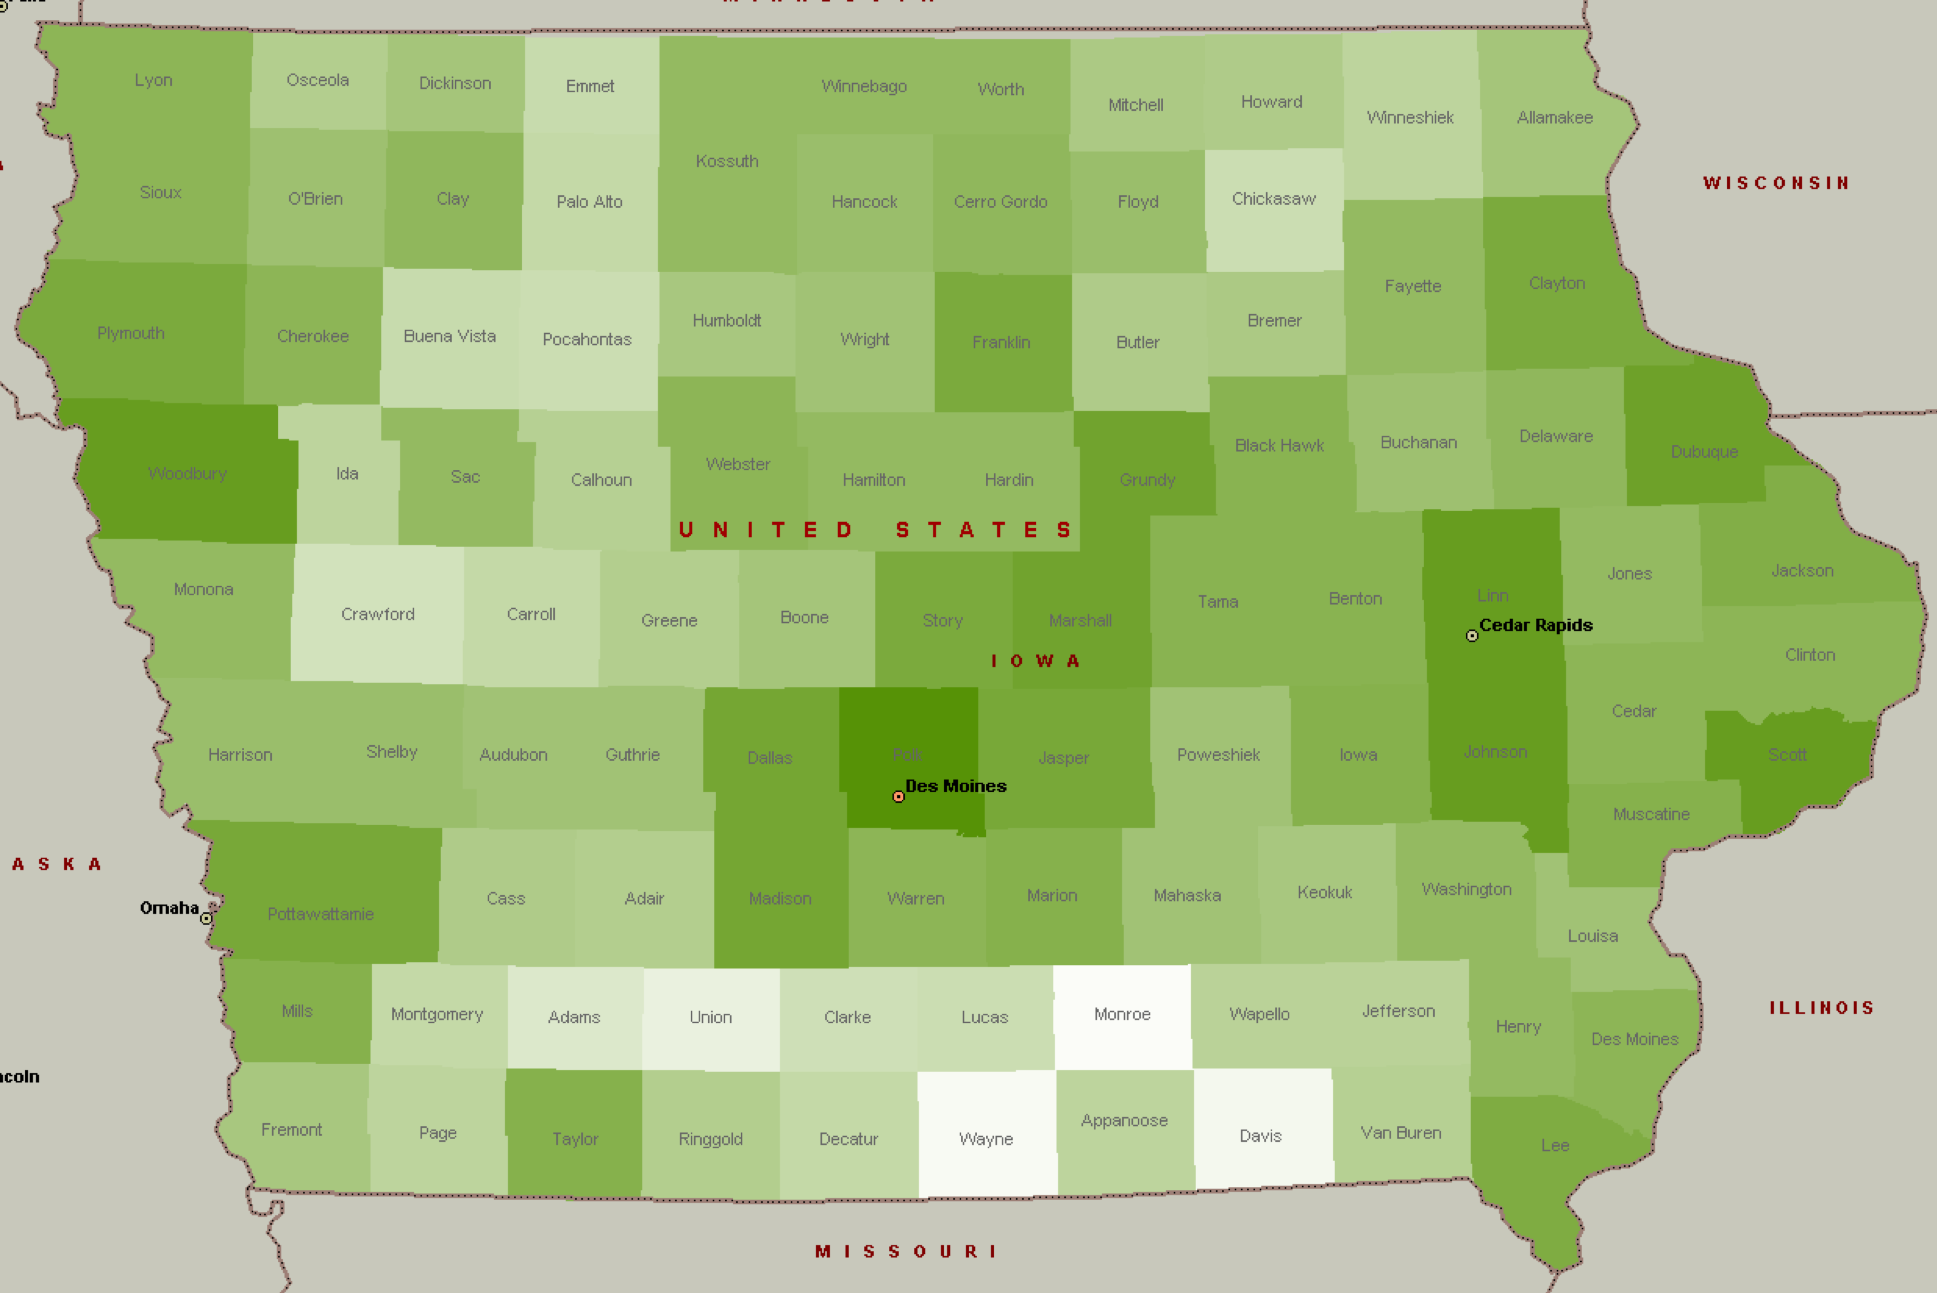
The above is Honda ownership density by county. The darker counties represent a more likely chance you’re going to see a Honda going down the road then not.

Chevrolet ownership density indicates a somewhat different story.

Buick is yet another density map.

Each brand has associated with it different traits and reasons why people decided on that brand. But what does it mean own different brands? Our research indicates that traits of people differ by brand and model. This particular post does not talk about data at the model level. We may examine one brand and various models in a later post.

Overall, the top 10 brands sold in Iowa that have high trait density (> 1.75 times the US average) for the above brands. If you were trying to sell a Chevrolet in Iowa, You’re messaging should be motion, feeling, leisure and biological oriented.

If you’re trying to sell a Toyota in Iowa you would prioritize different traits as indicated above.

What does it mean to prioritize traits?

It means focusing on different verbal usage, different creative and messaging that helps people realize that this brand solves a particular job to be done. It also means different media types and placements, not based on CPM but based on clear connections to the audience. Social media and optimistic topics can’t hurt when selling a Toyota in Iowa.

There are many different car manufacturers for a reason and likewise there’re many different models for the same reason. People have complex jobs to be done and one make and model does not solve them all. Whether it’s by purpose or by a haphazard strategy, manufacturers have found different needs and people.

Marketers such as Netflix, Amazon and a host of others realize this possibility and apply sophisticated capabilities and algorithms when understanding people.

Using a sophisticated technology, you can see data and people in a different way, based on a foundation of revenue and profit potential.

Jobs-to-Be-Done and Profits — Can They be Connected?

For many years, marketers have tried to match the products they sell with data to indicate product and market success. In my early days as a marketing automation person, I connected online data from specific search terms to purchases. It works very well. As my client base shifted from smaller to larger customers that operated stores, call centers and e-commerce, the complexity of valuing the results grew.

The complexity of sophisticated segmenting, targeting and positioning approaches often outstrips the organization’s ability to manage them. Compound this with the cost of the media and you have a great system working against itself.

Jobs to be done theory prioritizes different sets of data that deemphasizes complex systems and costly media.

A job to be done (JTBD) is a revolutionary concept that guides you toward innovation and helps you move beyond the norm of only improving current solutions. A JTBD is not a product, service, or a specific solution; it’s the higher purpose for which customers buy products, services, and solutions.

By changing the model from customer to job, we create hyper efficiencies, removing many things that just don’t matter.

In our research the criteria must include the traits of the person as a critical factor. By having a predictive theory of traits, connected to real-world CRM data, you find the traits that drive profit and why personality traits hire products. A handful of traits are why we buy.

For example, a person who is risk averse is more likely to hire no deductible auto insurance or an auto warranty policy to lower their anxiety about the unknown. A person who desires to lower anxiety has alternative product choices that can replace insurance and warranties to accomplish this goal. They can hire Uber instead of buying a car. If you embrace the real reason why they might hire insurance, you can solve their problem better than Uber can.

The reason we may generate a job to do is related to our personality traits and the criteria by which we hire a product is also related to the same traits. The way of doing a job is guided by our traits. When you connect the theory of a person with the causal reason they decide to hire something and attach revenue and profit to make it practical, you have a simple system that connects traits to profits.

You can create the ‘why’ much better and faster, informing and driving nearly every department in the organization. You can also create the look-a-like CRM in a matter of hours.

As Thomas Levitt once said, “People don’t want to buy a quarter-inch drill. They want a quarter-inch hole.” Customers don’t want products, they want solutions that are created by hiring products they can trust will do the job. Trait theory, turned into a predictive, Jobs to be Done software application, connected and proven by your CRM, removes complexity and aligned teams to yield far better results.